Baseball has hundreds of stats to measure players’ value and performance, and on top of that we’ve added an “x” or another variable on top of those stats in recent years to measure how players should be valued and should have performed. It’s all good information, yes, but it’s a lot to keep track of – even for the most engaged fans in baseball analytics. Despite this overload of readily available information, it’s a common occurrence in the baseball community – from the broadcast booth to the nerdiest of comment sections – to observe a hitter’s stats through a different lens because of his position then summarize with nothing more than a euphemism along the lines of “that’s good/bad for a [position].” We know that it’s different when Alejandro Kirk bats .285 with 14 HRs as a catcher than when Gio Urshela does the same (13 HRs) as a third baseman. But for the sport with the best marriage of the eye test and data in player evaluation, why just leave it at that?
Now, I’m not claiming to be the first person to take the proverbial swing at adjusting performance at the plate for defensive position, but I do know that it’s not currently part of the baseball zeitgeist and that the two main sources behind the WAR stat (Baseball Reference and FanGraphs) weigh positional value for historical scale and purely defense, respectively. In theory it absolutely makes better sense to focus on positional adjustment for players’ time spent literally playing those positions, but I think keeping this realignment strictly to glovework tells only part of the story. Positionless roster construction has been the rage across sports for years now, with NBA players who take the ball up the court being taller than those playing center and NFL linebackers being the same size as safeties. Baseball wasn’t left out of this movement of homogeneity either. The Ben Zobrist utility types became the muses of GMs around the league while managers exponentially emphasized defense shifts that warped the diamond far from Abner Doubleday’s 150 year-old model. I say all of this to say that it’s time to recalibrate the scales of pure positioning. Look no further than the 2022 Red Sox, who played outfielders at first base and first basemen at third base and third basemen in the corner outfield and corner outfielders in centerfield. Boston remained among the league’s elite offenses but finished near the basement of defensive team performance along the likes of the Pirates and Nationals – and that was with Xander Bogaerts and Trevor Story playing great defense up-the-middle. Even if the best answer is somewhere in the middle of the great Moneyball scene where Billy Beane and Ron Washington differ on whether playing first base is hard, the truth of the matter is this: playing YOUR position matters, as does playing it well, and we aren’t collectively too smart to admit what the game had correct for 100+ years.
So now that we’ve established that it’s legitimate to evaluate players by their designated positions, that opens the door for us to quantify offensive performance by designated position too. I didn’t want to give credence to the ~40 innings Mookie Betts plays at second base and other similar instances around the league because that’s against the point of this exercise, so I limited positional eligibility and statistical inclusion to 50+ plate appearances (PA) per position. So, in the example of Betts, who had 24 PA while listed as a second baseman in the box score, he’s only a rightfielder according to this stat. Still, this parameter provides 981 qualifiers across 496 players. A true utilityman like Wilmer Flores, who took 100+ PA at 1B/2B/3B/DH, accounts for 4 of those 981 listings. It’s not 100% conclusive but it’s a significant dataset.
The wRC (Weighted Runs Created) stat, used to create the popular wRC+ stat, is at the heart of this analysis, even if rRC (Relative Runs Created) and rRC+ differ from wRC+ – more on that difference later. wRC+ (formula here) relies on a multitude of league averages and external factors to condense offensive performance into one round number. In terms of leveling the playing field, wRC+ is vulnerable to crooked numbers for smaller sample sizes. For example, drop the Minimum Plate Appearance qualifying total to 150 and you have Matt Carpenter pacing the league in wRC+ over Aaron Judge and way ahead of Yordan Alvarez and Paul Goldschmidt. Even if Carpenter was on fire over his 47 games, that’s pretty silly. As an admittedly simpler approach, I divided each player’s qualifying PA total by 500 (the approximate batting title requirement) then multiplied that amount by that player’s wRC total. From there – and this was the long part – I averaged out the offensive outputs proportionally for each player that appeared on the list across 2+ positions. Take Albert Pujols, who took 75% of his at bats as the Cardinals’ DH and the other 25% at 1B. Three-quarters of his rRC total comes from three-quarters of his wRC total at DH, with the other quarter coming from his wRC total at 1B. Here is a table containing the variables that I used to transform wRC over the 500 PA threshold into this new rRC stat:
| Position | wRC/500 | Percentage from Average |
|---|---|---|
| C | 47.09 | 15.51% |
| 1B | 60.58 | -10.20% |
| 2B | 52.36 | 3.89% |
| 3B | 53.97 | 0.79% |
| SS | 51.68 | 5.25% |
| LF | 60.08 | -9.46% |
| CF | 49.80 | 9.23% |
| RF | 54.74 | -0.64% |
| DH | 59.65 | -8.81% |
It shouldn’t come as much of a surprise that the least valuable offensive position over 2022 was catcher with an average wRC/500 of 47.09 across qualifiers. The average wRC/500 across all positions was 15.51% higher than that figure, so the wRC/500 of every catcher was multiplied by 1.1551 to obtain his rRC. To quickly recap the rest of the diamond, centerfield also significantly lags in offensive value while the middle infield trails by a more normal amount. Third base and rightfield are roughly average, and significantly superior offensive value is found at first base, leftfield and DH.
rRC = [Position A (500/PA) x wRC) x (Positional Percentage from Average)] + [Position B…]
Make sense? Hope so, because we’re powering through to the final step of the methodology. Once each player had one rRC total across all of his positional eligibility, I took the league average across the player pool (54.2 rRC). With that number in hand, it’s a straightforward percent growth formula as a final step to reach the desired rRC+ stat. I’m a fan and regular user of the wRC+ stat despite what could have come across as criticism in the previous paragraph. It’s a great stat even if I do have reservations on the basis of the formula – namely that it’s my opinion we’ve gone too far with “ballpark factor” accounting, AKA curving down the offensive stats at Coors Field. I guess we still haven’t hit the necessary quota of Rockies hitters that continue to rake after leaving Denver’s altitude before reconsidering less attribution of their home/away splits to thin air and more to the idea that maybe – just maybe – baseball players are human beings who are more comfortable in the ballpark where they play 81 games per year. The Rockies organization hasn’t exactly been a factory for pitching development since its 90s inception either. Alas, that’s enough of that tangent. If I let my ego run completely wild and visualize a world where rRC+ catches on, I wouldn’t want it to replace wRC+. I’d want them to co-exist, so it’s important to me to not just stop at the rRC flat totals but also adjust to a rounded and more digestible percent-from-average stat. (As a brief primer, if a player has a wRC+ of 100, he created runs at the league-average rate. If a player has a wRC+ of 120, he created runs at a 20% clip above league average. If a player has a wRC+ of 80, he created runs at a 20% clip below league average.)
ENOUGH MATH, DORK. Let’s have some fun and see what rRC and rRC+ tells us!
rRC+ LEADERBOARDS
Min. 200 PA
- Aaron Judge (NYY, CF/RF/DH): 223
- Mike Trout (LAA, CF): 209
- Jose Altuve (HOU, 2B): 180
- Yordan Alvarez (HOU, LF/DH): 174
- Danny Jansen (TOR, C): 170
- William Contreras (ATL, C/DH): 168
- Paul Goldschmidt (STL, 1B/DH): 167
- JT Realmuto (PHI, C): 162
- Michael Harris II (ATL, CF): 162
- Julio Rodriguez (SEA, CF): 159
Min. 500 PA
- Aaron Judge (NYY, CF/RF/DH): 223
- Jose Altuve (HOU, 2B): 180
- Yordan Alvarez (HOU, LF/DH): 174
- Paul Goldschmidt (STL, 1B/DH): 167
- JT Realmuto (PHI, C): 162
- Julio Rodriguez (SEA, CF): 159
- Manny Machado (SDP, 3B/DH): 158
- Austin Riley (ATL, 3B): 158
- Nolan Arenado (STL, 3B/DH): 158
- Rafael Devers (BOS, 3B): 156
- Xander Bogaerts (BOS, SS): 156
- FULL LEADERBOARDS: https://docs.google.com/spreadsheets/d/1YcVVbKyYzVfFmdm7cKOVi-Jxmjda85ApMeanutuhEog/edit?usp=sharing
- Aaron Judge and Mike Trout…pretty damn good! They are arguably the top two hitters in the game right now regardless of position, but once you consider that they each took a bulk of their at bats listed as a centerfielder…it’s not even much of a debate. Judge, in particular with his full-season volume, finds himself 43 points clear of the runner-up at the 500 PA threshold (Jose Altuve). That gap is equal to the one between Altuve and the 31st ranked player (Sean Murphy).
- Julio Rodriguez and Michael Harris II won Rookie of the Year for their respective leagues but they produced even better than the typical award-winning rookie. I’m prepared for these two to crack rRC+ leaderboards for years to come, even if Rodriguez eventually shifts over to rightfield. (Which, surprisingly and maybe an aberration for 2022, was a roughly average position from an offensive standpoint.)
- The rankings of catchers should jump out, particularly Danny Jansen and William Contreras sliding in right before NL MVP and near Triple Crown winner Paul Goldschmidt. As a reminder, this isn’t to say that Jansen and Contreras are actually better hitters than Goldschmidt; it’s saying that their offensive production at catcher is slightly more valuable over the course of a season than Goldschmidt’s at first base. It’s really close and the catchers have smaller sample sizes – much smaller in Jansen’s case – but I’m down with that conclusion! Jansen’s slash line of .260/.339/.516 with great walk and strikeout rates should mean more when he’s changing in and out of pads between innings. In his case, Jansen is theoretically in his prime and should provide Toronto with a massive edge over the course of a full season. That is…if he is still wearing a Blue Jays jersey come 2023 Opening Day. It’s presumed that Toronto will deal one of Jansen/Alejandro Kirk/Gabriel Moreno this offseason, and most predictions – even my own – have Jansen as the dealt player given Kirk and Moreno’s youth. But maybe we’ve underrated Jansen and Toronto could be better off with his immediate impact and Moreno’s massive talent waiting in the wings? Trading Kirk feels crazy – he finished 4th among AL catchers in WAR and is elite by the rRC+ standard in his own right (144) – but he should be able to land Toronto quite the catch. Perhaps Kirk straight-up for an established All Star like Shane Bieber or Bryan Reynolds – or Kirk plus minor prospect compensation – is a win/win framework for both sides?
- I want to focus more on the top of the leaderboard than the bottom, but quick note on the duds of the list. 21 players with 500+ PA finished beneath the even rRC+ of 100…and two of them were Yankees: Josh Donaldson (98) and Isiah Kiner-Falefa (89). The Astros, Phillies, Braves, Mets and Dodgers had three combined. The deepest of sighs.
rRC+ vs. wRC+
wRC+ Rank of rRC+ Top 10 (Min. 200 PA)
- Aaron Judge: 1st, 207 wRC+
- Mike Trout: 4th, 176
- Jose Altuve: 5th, 164
- Yordan Alvarez: 2nd, 185
- Danny Jansen: 23rd, 140
- William Contreras: 29th, 138
- Paul Goldschmidt: 3rd, 177
- JT Realmuto: 52nd, 128
- Michael Harris II: 34th, 136
- Julio Rodriguez: 11th, 146
wRC+ Rank of rRC+ Top 10 (Min. 500 PA)
- Aaron Judge: 1st, 207
- Jose Altuve: 4th, 164
- Yordan Alvarez: 2nd, 185
- Paul Goldschmidt: 3rd, 177
- JT Realmuto: 35th, 128
- Julio Rodriguez: 8th, 146
- Manny Machado: 6th, 152
- Austin Riley: 15th, 142
- Nolan Arenado: 7th, 151
- Rafael Devers: 17th, 140
- Xander Bogaerts: 25th, 134
Top Risers from wRC+ to rRC+ (Min. 200 PA)
- Yan Gomes (CHC, C): +44 (73 to 117)
- Eric Haase (DET, C): +43 (112 to 155)
- Elias Diaz (COL, C): +36 (67 to 103)
- Travis d’Arnaud (ATL, C): +35 (120 to 155)
- JT Realmuto (PHI, C): +34 (128 to 162)
- Mike Trout (LAA, CF): +33 (176 to 209)
- Brian Serven (COL, C): +32 (52 to 84)
- William Contreras (ATL, C/DH): +30 (138 to 168)
- Danny Jansen (TOR, C): +30 (140 to 170)
- Yonathan Daza (COL, LF/CF): +26 (93 to 119)
- Jose Iglesias (COL, SS): +26 (85 to 111)
- Michael Harris II (ATL, CF): +26 (136 to 162)
Top Risers from wRC+ to rRC+ (Min. 500 PA)
- JT Realmuto (PHI, C): +34 (128 to 162)
- Brendan Rodgers (COL, 2B): +24 (92 to 116)
- Gleyber Torres (NYY, 2B): +24 (115 to 139)
- Ryan McMahon (COL, 3B): +22 (95 to 117)
- Xander Bogaerts (BOS, SS): +22 (134 to 156)
- Randal Grichuk (COL, RF/CF): +22 (88 to 110)
- Kyle Farmer (CIN, 3B/SS): +19 (91 to 110)
- Dansby Swanson (ATL, SS): +16 (116 to 132)
- Will Smith (LAD, C/DH): +16 (127 to 143)
- Bryan Reynolds (PIT, CF/DH): +16 (125 to 141)
- Jose Altuve (HOU, 2B): +16 (164 to 180)
- Rafael Devers (BOS, 3B): +16 (140 to 156)
- Cedric Mullins (BAL, CF): +16 (106 to 122)
- Austin Riley (ATL, 3B): +16 (142 to 158)
- Aaron Judge (NYY, CF/RF/DH): +16 (207 to 223)
- Brandon Nimmo (NYM, CF): +16 (134 to 150)
Top Fallers from wRC+ to rRC+ (Min. 200 PA)
- Brandon Belt (SF, 1B): -31 (96 to 65)
- Jace Peterson (MIL, 3B): -21 (96 to 75)
- Ji-Man Choi (TBR, 1B): -19 (115 to 96)
- Aledmys Diaz (HOU, LF/SS/2B): -17 (96 to 79)
- Brad Miller (TEX, DH/3B/LF): -15 (69 to 54)
- Harold Ramirez (TBR, RF/DH/1B): -15 (119 to 104)
- Austin Slater (SFG, CF): -14 (124 to 110)
- Wil Myers (SDP, 1B/RF): -13 (104 to 91)
- Josh Naylor (CLE, 1B/DH): -12 (117 to 105)
- Chris Taylor (LAD, LF/2B): -11 (93 to 82)
- Jesse Winker (SEA, LF/DH): -11 (108 to 97)
- Yordan Alvarez (HOU, LF/DH): -11 (185 to 174)
- Pete Alonso (NYM, 1B/DH): -11 (143 to 132)
- Anthony Rizzo (NYY, 1B): -11 (132 to 121)
Top Fallers from wRC+ to rRC+ (Min. 500 PA)
- Jesse Winker (SEA, LF/DH): -11 (108 to 97)
- Yordan Alvarez (HOU, LF/DH): -11 (185 to 174)
- Pete Alonso (NYM, 1B/DH): -11 (143 to 132)
- Anthony Rizzo (NYY, 1B): -11 (132 to 121)
- Nathaniel Lowe (TEX, 1B): -10 (143 to 133)
- Seth Brown (OAK, RF/CF/LF/1B): -10 (116 to 106)
- Ty France (SEA, 1B): -10 (127 to 117)
- Randy Arozarena (TBR, RF/LF/DH): -9 (125 to 116)
- Vladimir Guerrero Jr (TOR, 1B/DH): -9 (132 to 123)
- Rhys Hoskins (PHI, 1B): -9 (122 to 113)
- Luis Arraez (MIN, 1B/DH/2B): -9 (131 to 122)
- Having JT Realmuto and his slash line of .280/.342/.489 behind 547 PA from the catcher position rise from 52nd and 35th in wRC+ to crack both rRC+ leaderboards – including the Top 5 among the largest sample size – is the precise intention of this exercise. Realmuto is one of the most valuable players in baseball, period.
- The top risers, unsurprisingly, are mostly players at up-the-middle positions. Guys like Xander Bogaerts jump from the great to elite tier, Gleyber Torres from good to great, and Kyle Farmer (.255/.315./386 with 388 PA at shortstop) from mediocre to good.
- I love that Yan Gomes is atop a list of risers per rRC+ compared to wRC+. He’s long been an unsung player that I admire and this stat is a good way to credit his game. If you sought out a player with a wRC+ around 115 and positive defense on an annual basis, you’d land on solid players with enough recognition like Kolten Wong or Lourdes Gurriel. But in my opinion, and now backed by rRC+, a catcher like Gomes belongs in that company too.
- On the flip side, you’ll find mostly first basemen, leftfielders and DH types among the top fallers. The point of rRC isn’t to totally detract from awesome hitters at these positions with high offensive expectations, and that shows here with Yordan Alvarez and Pete Alonso sliding a bit but still posting excellent rRC+ numbers. However, for guys like Brandon Belt and Wil Myers who have relatively normal slash lines but also have their positional counterparts around the league outperforming them, rRC is built to expose them.
- I don’t blame any baseball fans who hadn’t been privy to the extreme impact of “ballpark factor” on mainstream stats, but look no further than the above lists. You have a pure third baseman in the Top 5 for risers (Ryan McMahon) and another pure third baseman in the Top 5 for fallers (Jace Peterson). Same goes for centerfield, where Mike Trout cracked the Top 10 for risers yet Austin Slater of the Giants landed similarly among the top fallers. I get that it matters but I swear, the more I dig into this the more I’m starting to believe that some statisticians forget that players in different types of ballparks do, in fact, play the same sport of baseball.
rRC and Defense
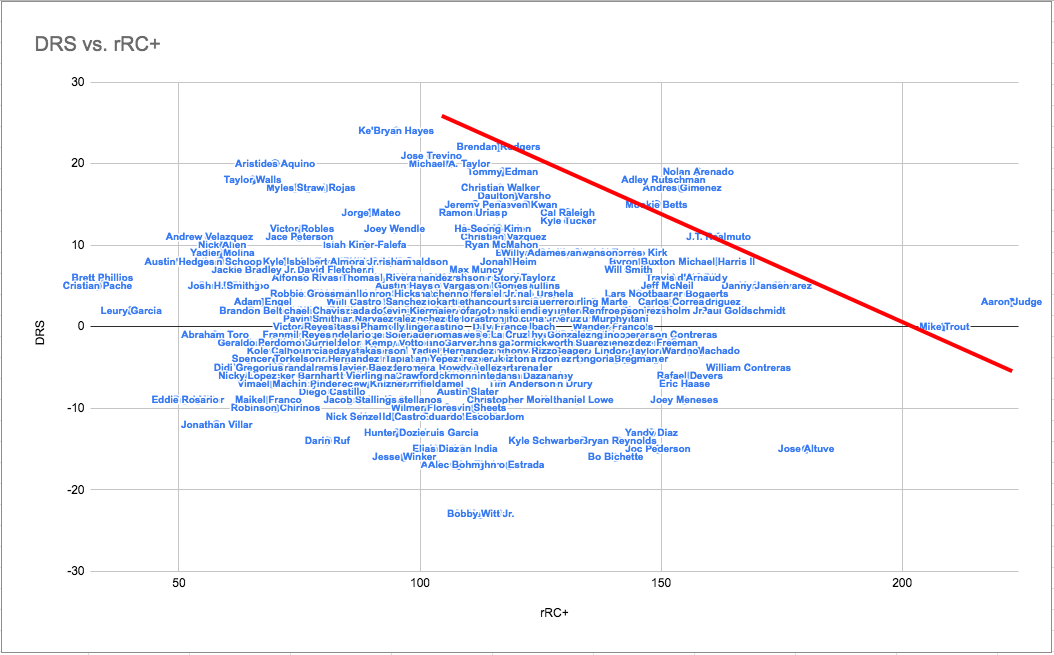
Now that offensive production has been positionally quantified, it feels like an appropriate bookend to this exercise to marry rRC with the positional defensive production that has been measured statistically for years now. Defensive stats are somewhat flimsy by nature and there are a number of versions now that sometimes spit out contrary numbers for the same player, but Defensive Runs Saved has become ol’ reliable in the space and is still one of the best for quantifying glovework. In the below graph, rRC+ is charted against DRS for all players with 200+ PA. It’s a visual mess, but that does mean the graph is working because the vast majority of players land in a condensed perimeter around the origin of 100 rRC+ and 0 DRS. For the purpose of instant analysis, we’ll center in on the outliers here.

- If you surveyed 100 baseball fans in a Family Feud style on the best all-around player in baseball right now – non-Ohtani division – the top two answers on the board might be Nolan Arenado and Mookie Betts. The data agrees, with each of them playing elite defense with bats that are roughly 50% above their positional averages.
- Adley Rutschman started the 2022 season in High-A minor league ball and finished the season as one of the best all-around players in MLB. The kid is an absolute stud, with a rRC+ near that of Juan Soto and one of the most valuable gloves in the game. You have my word that I will have some action on Rutschman’s 2023 AL MVP odds.
- My pick for the most underrated player in baseball right now is probably Andres Gimenez. He’s not an unknown commodity by any means; he did make the All Star team and won a Gold Glove in 2022. But this is a dude who produced like 2021-2022 Carlos Correa across a full season of work, and Correa might be days away from landing himself a $300mil contract. Gimenez doesn’t light up a Statcast page but he’s an immensely talented player who could pull a 2014-2019 Anthony Rendon and post multiple 6.0 WAR seasons before he’s finally given the recognition he’s due.
A Diamond in the Rough…and Yankees Trade Target?
This is the same graph as above, just with a slope introduced to create a sort of “top tier” of players that intentionally encapsulates Aaron Judge and Mike Trout as the massive offensive outliers. The other players on the best side of this line have all been the subject of praise in this blog already: Realmuto, Betts, Gimenez, Rutschman and Arenado. But then there is also…Brendan Rodgers?! I’m not suggesting that this analysis dictates that the Rockies’ second baseman belongs in the company of bona fide superstars and budding superstars, but maybe there is something to Rodgers that the baseball community is largely missing? His fielding prowess isn’t a secret; Rodgers did just win the NL Gold Glove at second base. The potential secret here instead is that Rodgers’ fielding is so good and that his hitting relative to other second basemen is much better, so that when you combine those two factors you could have one player who is truly – and perhaps secretly – excellent at his position. Only JT Realmuto gained more by rRC+ compared to wRC+ than Rodgers among hitters with 500+ PA, and that’s without taking into account that Rodgers was literally the worst hitter in MLB in April with a grotesque slash line of .078/.172/.098. Just about every hitter deserves the benefit of the doubt for a slump – especially once he rebounds – and ESPECIALLY when that slump occurs immediately after an owner-forced lockout that basically did away with Spring Training.
That offensive rebound, coupled with Rodgers seemingly finding a permanent home at second base after coming up through the ranks as a shortstop, indicates that he has all the makings of a post-hype sleeper on the rise. So, why might the Rockies entertain trading him? Well, consider his other stats of 1.7 WAR and 92 wRC+ that paint him as a relatively pedestrian player. He is also entering his first season eligible for arbitration, so while the Rockies aren’t a poor club they are cost-conscious and already have an inflated payroll. It could behoove them to float Rodgers in trade talks in order to get younger and cheaper elsewhere on the roster. Who should be dialing out to Denver if Rodgers does indeed become attainable via trade? Does this spray chart give any hints?
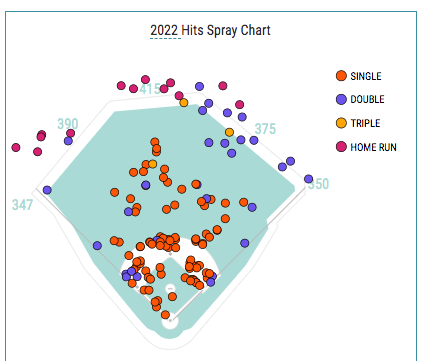
That is a calling for the Yankee Stadium short porch if I’ve ever seen one from a right-handed hitter! Rodgers peppers the ball the opposite way and does it with authority (69% average exit velo, 83% max exit velo) – albeit to some detriment at the moment with an NL-leading 25 double plays grounded into last season. Get this: among all righty hitters with 200+ PA in 2022, only five of those 207 hit the ball the opposite way AND hit the ball hard at least 30% of the time: Bo Bichette, Ke’Bryan Hayes, Seiya Suzuki, Yandy Diaz…and Rodgers. Rodgers, the former 3rd overall pick in the MLB Draft, is a huge talent who is already coming into his own but could be fully unlocked with an ideal change of scenery. It’s not a total coincidence that his situation is eerily similar to that of DJ LeMahieu when he left Colorado to sign with the Yankees in 2019; it’s a lofty thought, but I can envision a similar output for Rodgers in pinstripes.
The Yankees don’t exactly have a need at second base and they are vocally out of the free agent shortstop market with Oswald Peraza and Anthony Volpe prepared to compete for that job for the foreseeable future. It’s certainly possible, and arguably the best-case scenario for the Yankees, that Peraza and Volpe hold down the middle infield for the Yankees moving forward, but having a good alternative option at the keystone would be smart business for the Yankees while also limiting pressure on the two talented prospects. Gleyber Torres is already on the roster with manageable salaries projected for the next two years, and to his credit he also massively benefits by the shift from wRC+ to rRC+. At this stage of Gleyber’s career though, a team change could be best for him and the Yankees after years of consistent and dramatic up-and-down periods where both his natural baseball ability and headache-inducing ability are on full display. (For what it’s worth, Gleyber is a subject in the actual Hot Stove rumor mill too so I’m not projecting anything here.) What could a trade involving Rodgers and Torres look like? It would almost certainly need to be a three-way trade because it wouldn’t make any sense for Colorado to acquire Gleyber right now – even if the Rockies do have the MLB market cornered on nonsensical acquisitions. Here are some realistic-enough variations:
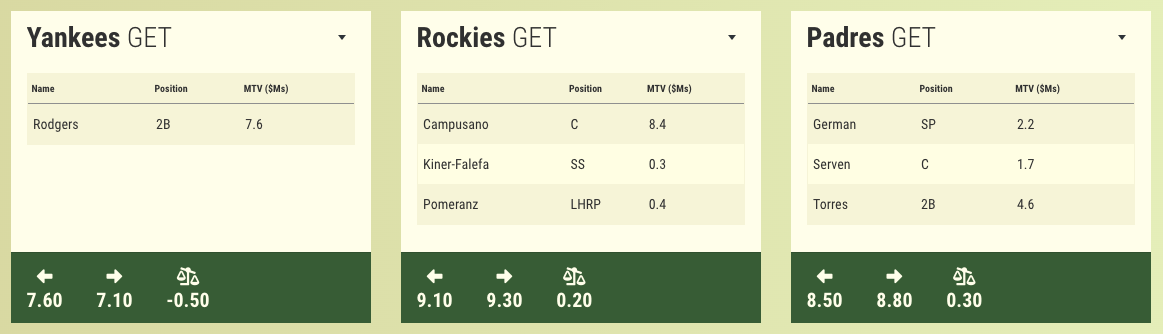
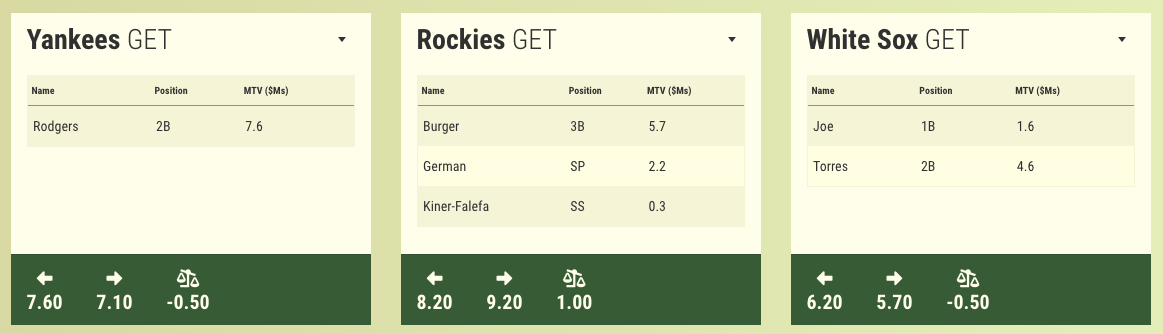
- In all of these proposals, the Yankees get Rodgers and send Isiah Kiner-Falefa to Colorado. Although I’d contend that IKF is a negative value asset at 1yr/$6mil, he could do a decent Jose Iglesias impression for the Rockies and could play every day for them across top prospect Ezequiel Tovar. The third team in these fake deals is always the one landing Torres too, and in this case it’s the Padres. San Diego tried to land Trea Turner but now will likely allow Ha-seong Kim to stay at shortstop while aiming levels below Turner to add a second baseman instead – assuming they slide Jake Cronenworth over to first base. These three ideas are intentionally different flavors from the Rockies’ perspective, and here they land a top prospect in catcher Luis Campusano. Campusano’s game has its flaws but he’s immensely talented and still young, so Colorado also inherits the undesirable $8mil owed to Drew Pomeranz in order to improve the prospect return.
- In this version, the White Sox – who currently have nobody resembling an Opening Day second baseman on their roster – land Torres along with a serviceable corner outfielder in Connor Joe. The Rockies acquire Jake Burger, a young masher without a defensive home who’s not dissimilar to Colorado’s recently-acquired Nolan Jones, and Domingo German. German would probably be the No. 2 starter in the Rockies’ rotation.
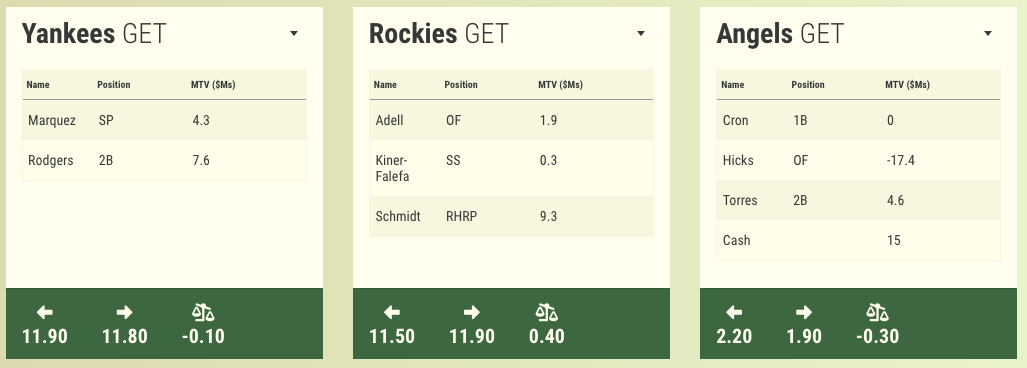
- This one is the most ambitious but also the most fun. It’s the version with the most Yankees’ involvement, with them also acquiring German Marquez from the Rockies – who I wrote about here (Trade No. 9) as a cost-effective buy-low pitcher on the trade market – and dumping half of Aaron Hicks’ contract onto Anaheim. The Rockies land two post-prime blue-chippers in Clarke Schmidt, who would immediately become their most skilled pitcher by a mile, and Jo Adell, the can’t-miss prospect who royally flamed out and desperately needs a chance for career revival in new digs. It’s hard not to love this idea as an Angels fan after they routinely trotted out some of the worst lineups of the 21st century last year around two of the most talented players the sport has ever seen. They would get two starting hitters in Torres and CJ Cron while Hicks, despite his limitations, would be a massive upgrade as an OF4 for the Angels. Suddenly, this group of position players for the Halos wouldn’t look too shabby:
- Gleyber Torres
- Mike Trout
- Shohei Ohtani
- Taylor Ward
- Anthony Rendon
- CJ Cron
- Hunter Renfroe
- Logan O’Hoppe
- Gio Urshela
Bench: Max Stassi, David Fletcher, Jared Walsh, Aaron Hicks
I’ll cut myself off from the trade machine and wrap this whole thing up before I drift too far away from rRC…you know, the point of this piece. I hope everyone who read this far appreciates the thought and effort, and I will gladly engage with any feedback! Follow on Twitter @Real_Peej
